Financey
UX/UI Research & Design

About
Roles: UX Researcher | UX/UI Designer
Duration: October 2021 - Dec 2021 | Revised May 2022 - August 2022
Tools: Adobe XD, Figma, Adobe Illustrator, Stata
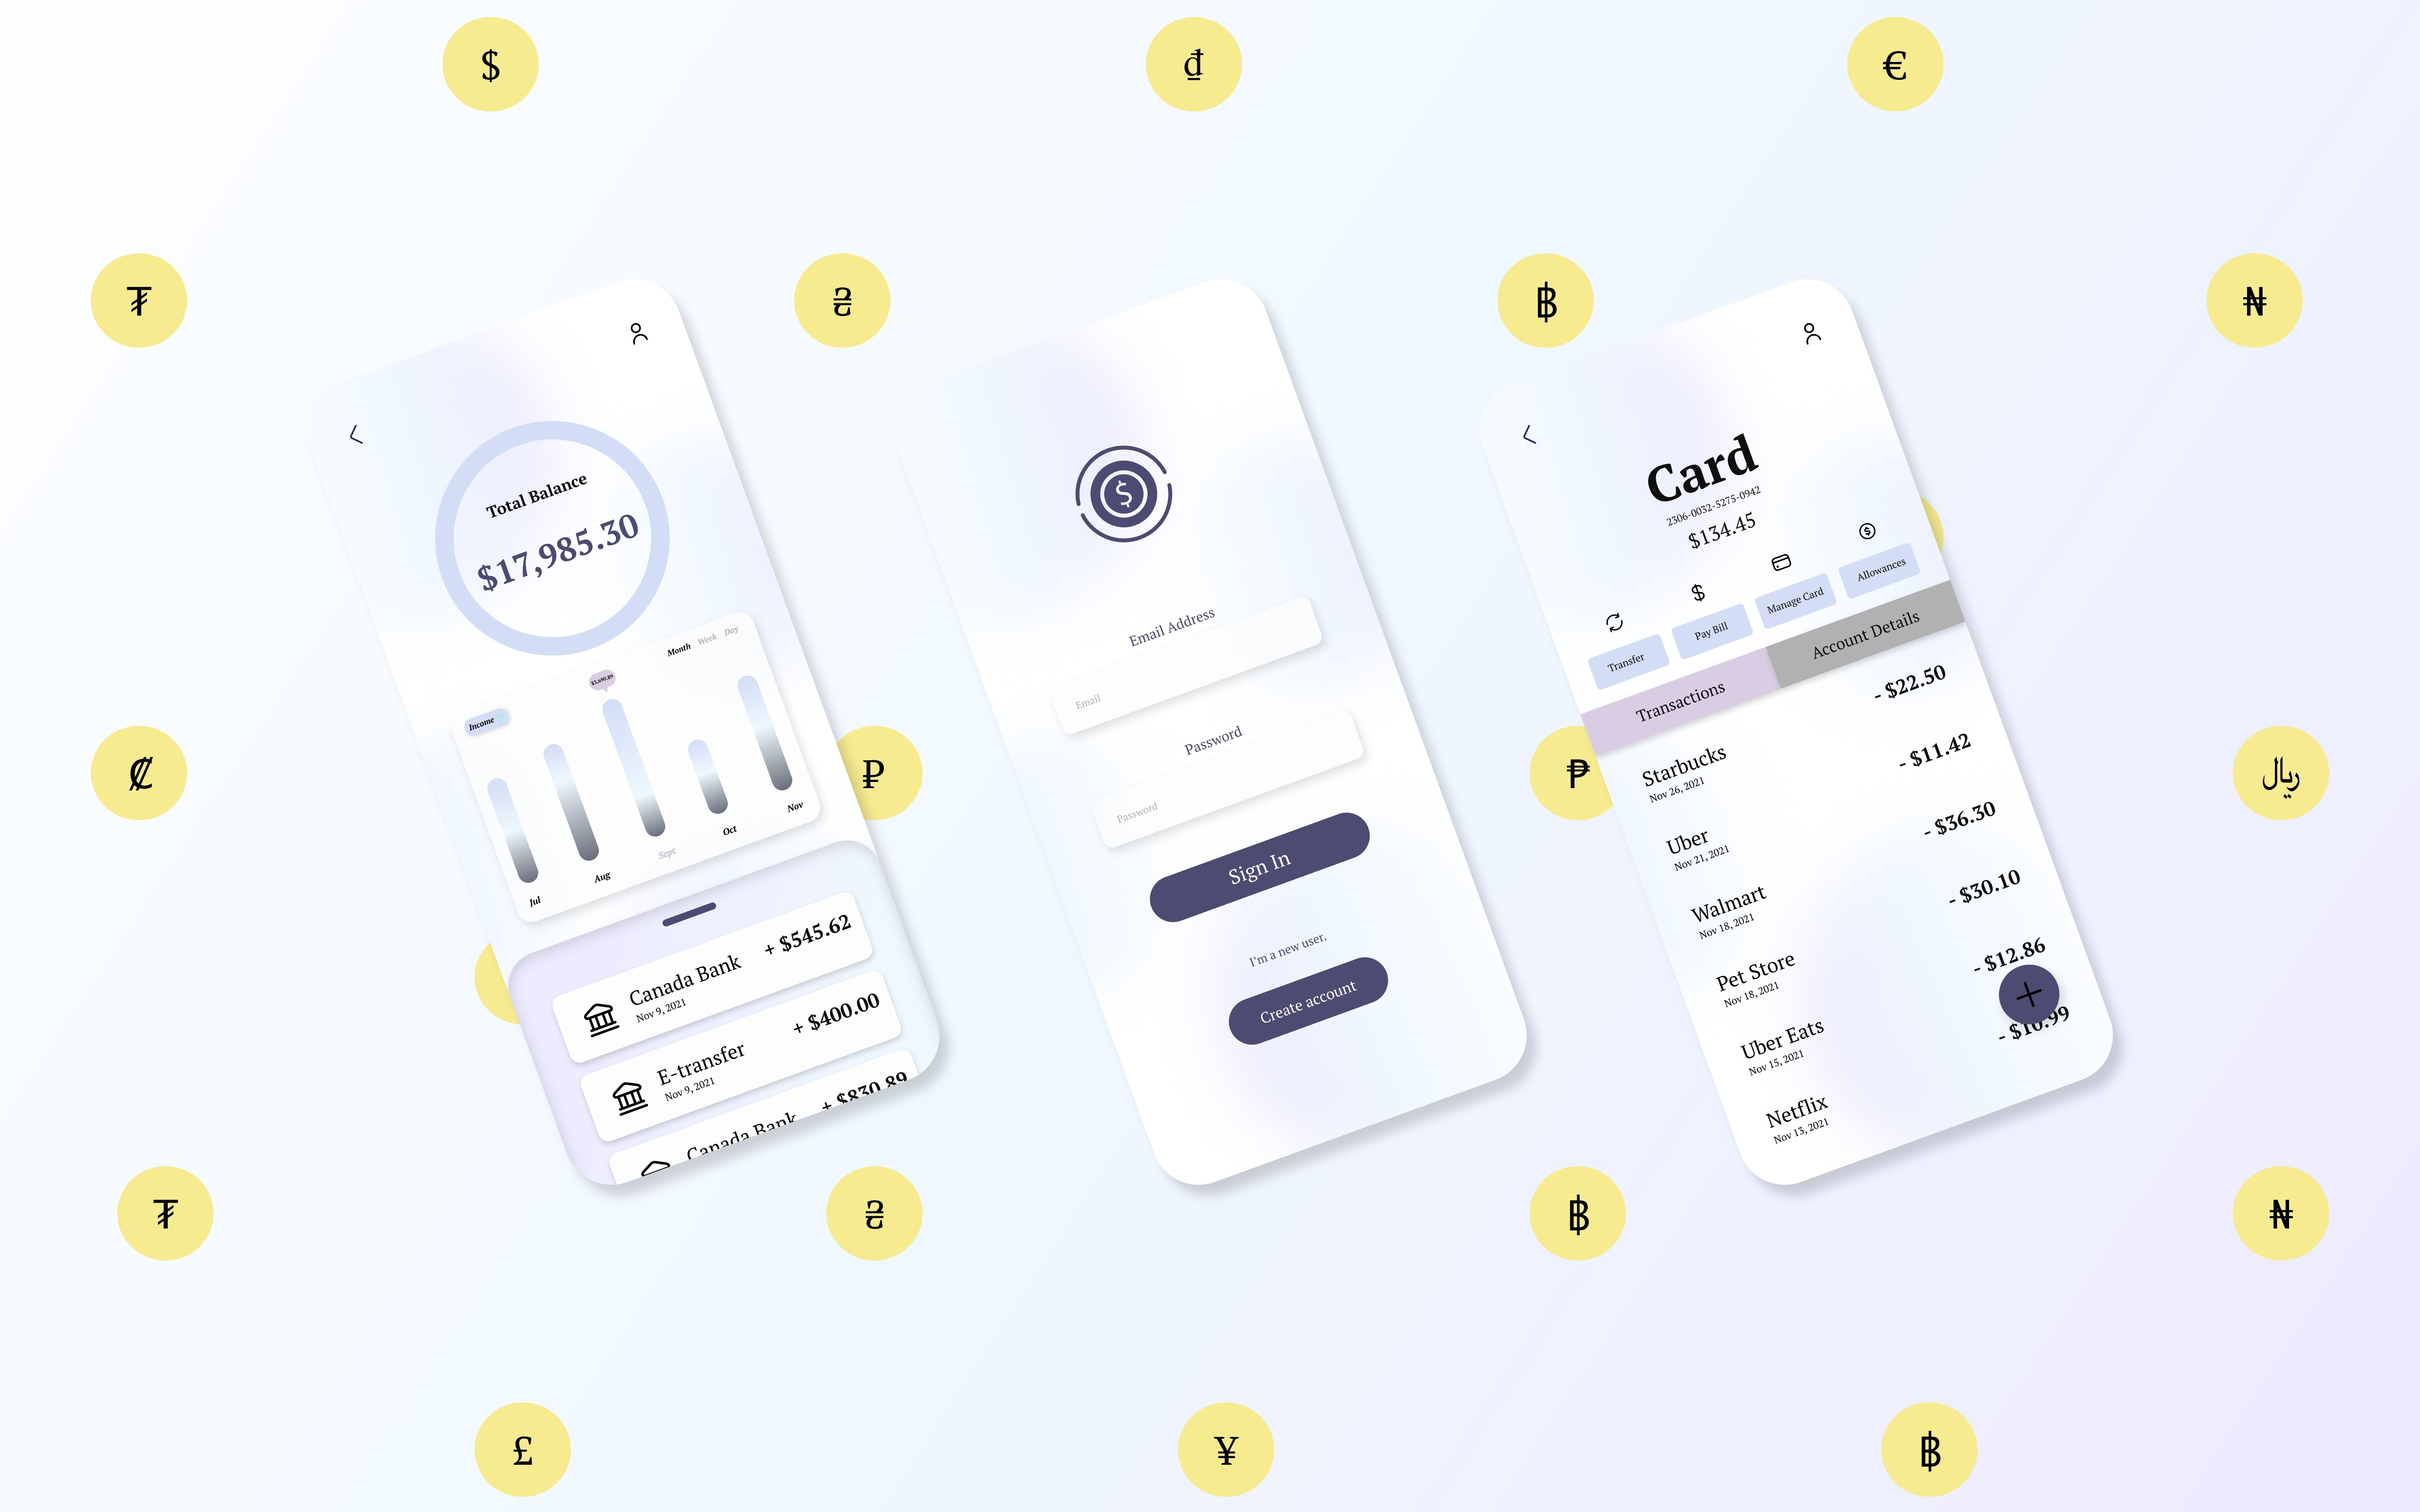
Financey helps users learn about personal finance and manage their money effectively. Financey also provides educational resources and access to financial advisors or coaches. The finance app can help users take control of their finances, improve their financial well-being, and work towards achieving their long-term financial goals.
Project Details
The Problem
The lack of financial education, management skills, and advice can have a significant negative impact on an individual’s financial well-being and quality of life. The absence of financial advice and guidance can also leave people feeling overwhelmed and uncertain about their financial future, leading to anxiety and stress.
The Goal
To empower users to make informed financial decisions, reduce financial stress, and achieve greater financial stability and success over time. It is also to provide users with the tools and resources they need to take control of their finances, improve their financial well-being, and work towards achieving their long-term financial goals.
UX Research
I started with a hybrid research methodology, commencing with the secondary research model in the initial segment of the study and shifting to qualitative research (interrogations and surveys) for the latter part. I performed quantitative analysis using Stata software and the MIDUS questionnaires. I generated syntax, computations, and tabulations on the topic of juvenile finance and comprehensive contentment by utilizing the responses from the mail section of MIDUS.
'MIDUS is a nationwide, long-term data collection in the U.S., placing emphasis on the impacts of psychological, societal, and biological factors in explaining the age-dependent fluctuations in health and happiness amongst two American national samples.'
Picture 1
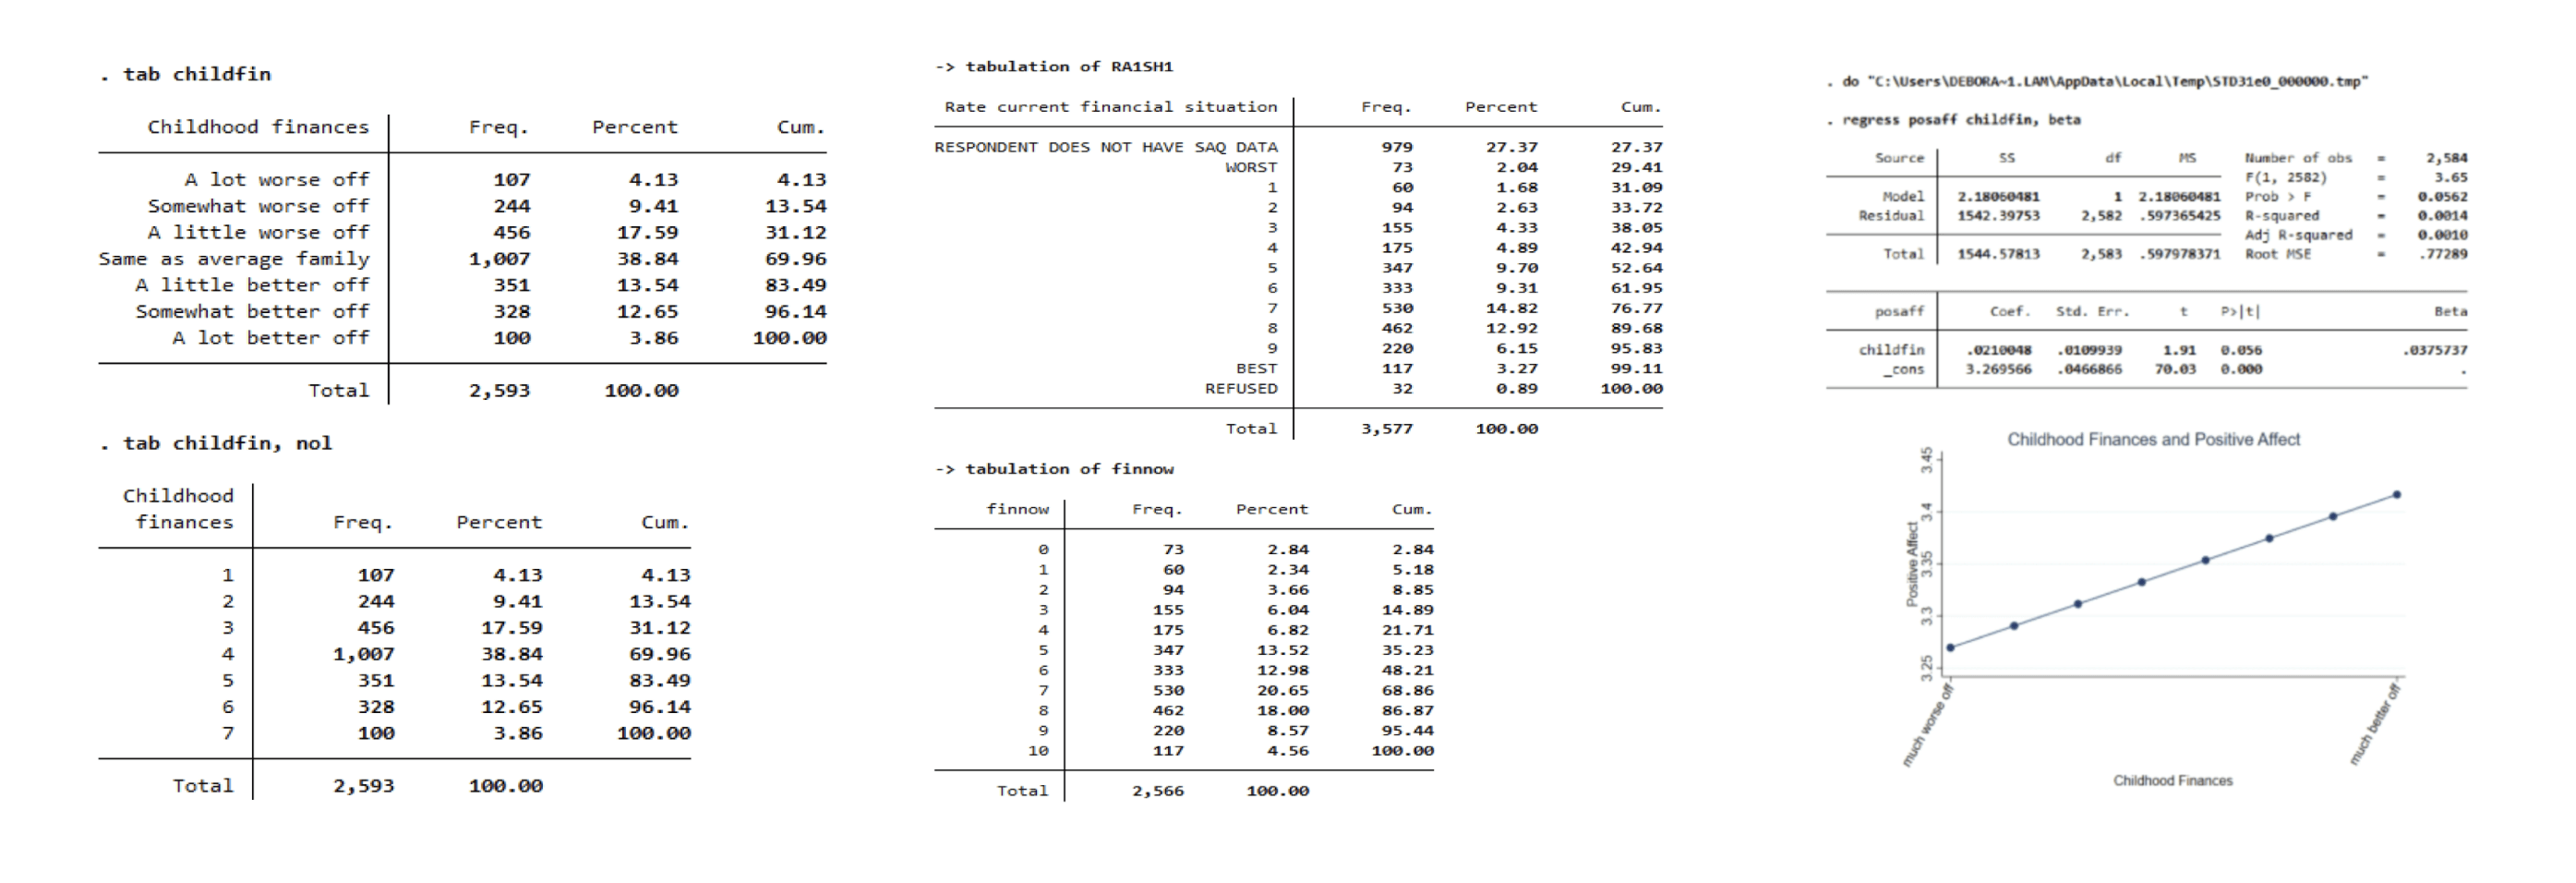
One of the respondents in the mail portion of the MIDUS was asked “Thinking back to your family’s financial situation when you were growing up, was your family better off or worse off financially than the average family was at that time?” I created a tabulation of the variable “childfin” with and without labels. Based on this tabulation, 2593 people provided valid responses to the question.
Picture 2
The query asked, “Employing a range from 0-10 where 0 symbolizes ‘the least desirable monetary state’ and 10 depicts ‘the most desirable monetary state,’ how would you evaluate your current financial standing?” My analysis focused on U.S residents between the ages of 25-75.
Picture 3
The query posed was, “Using a numerical gauge ranging from 0-10 where zero signifies ‘the worst imaginable financial state’ and ten implies ‘the optimal financial situation,’ how would you assess your current financial picture?” I proceeded with the computation while integrating various parameters. I examined factors such as happiness in life, present employment conditions, financial contentment, health, and lifestyle along with socio-economic standing. These could potentially impact both the extent of financial strain exposure and the state of one's mental health.
Survey
For this investigation, I gathered data from 40 individuals aged between 25 and 75. The participant pool comprises 23 men and 17 women. These people possess diverse income levels, familial structures, earnings, occupations, and educational backgrounds. This is a summary of the observations gathered from the study.
• Research Methodology: Survey
• Participants: 40
• Location: United States of America

User Interviews
In the user interviews, I gained valuable insights into diverse perspectives on financial education, technology's role in personal finance, and motivations for saving money. These interviews illuminate the multifaceted relationship individuals have with financial education, technology, and saving. The findings provide valuable perspectives for informing UX design in the realm of personal finance tools and resources.
Key Insights
• Financial education emerges as a crucial element for overall financial well-being.
• Survey findings indicate diverse strategies employed for financial management, encompassing budgeting, expense tracking, and regular savings.
• Identified areas for improvement include increased knowledge in investing and retirement planning.
• Participants reported facing financial challenges, such as unexpected expenses, job loss, and debt.
• Overcoming challenges involved the formulation of financial plans, seeking advice from professionals, and taking proactive measures to enhance income or reduce expenses.
Personas
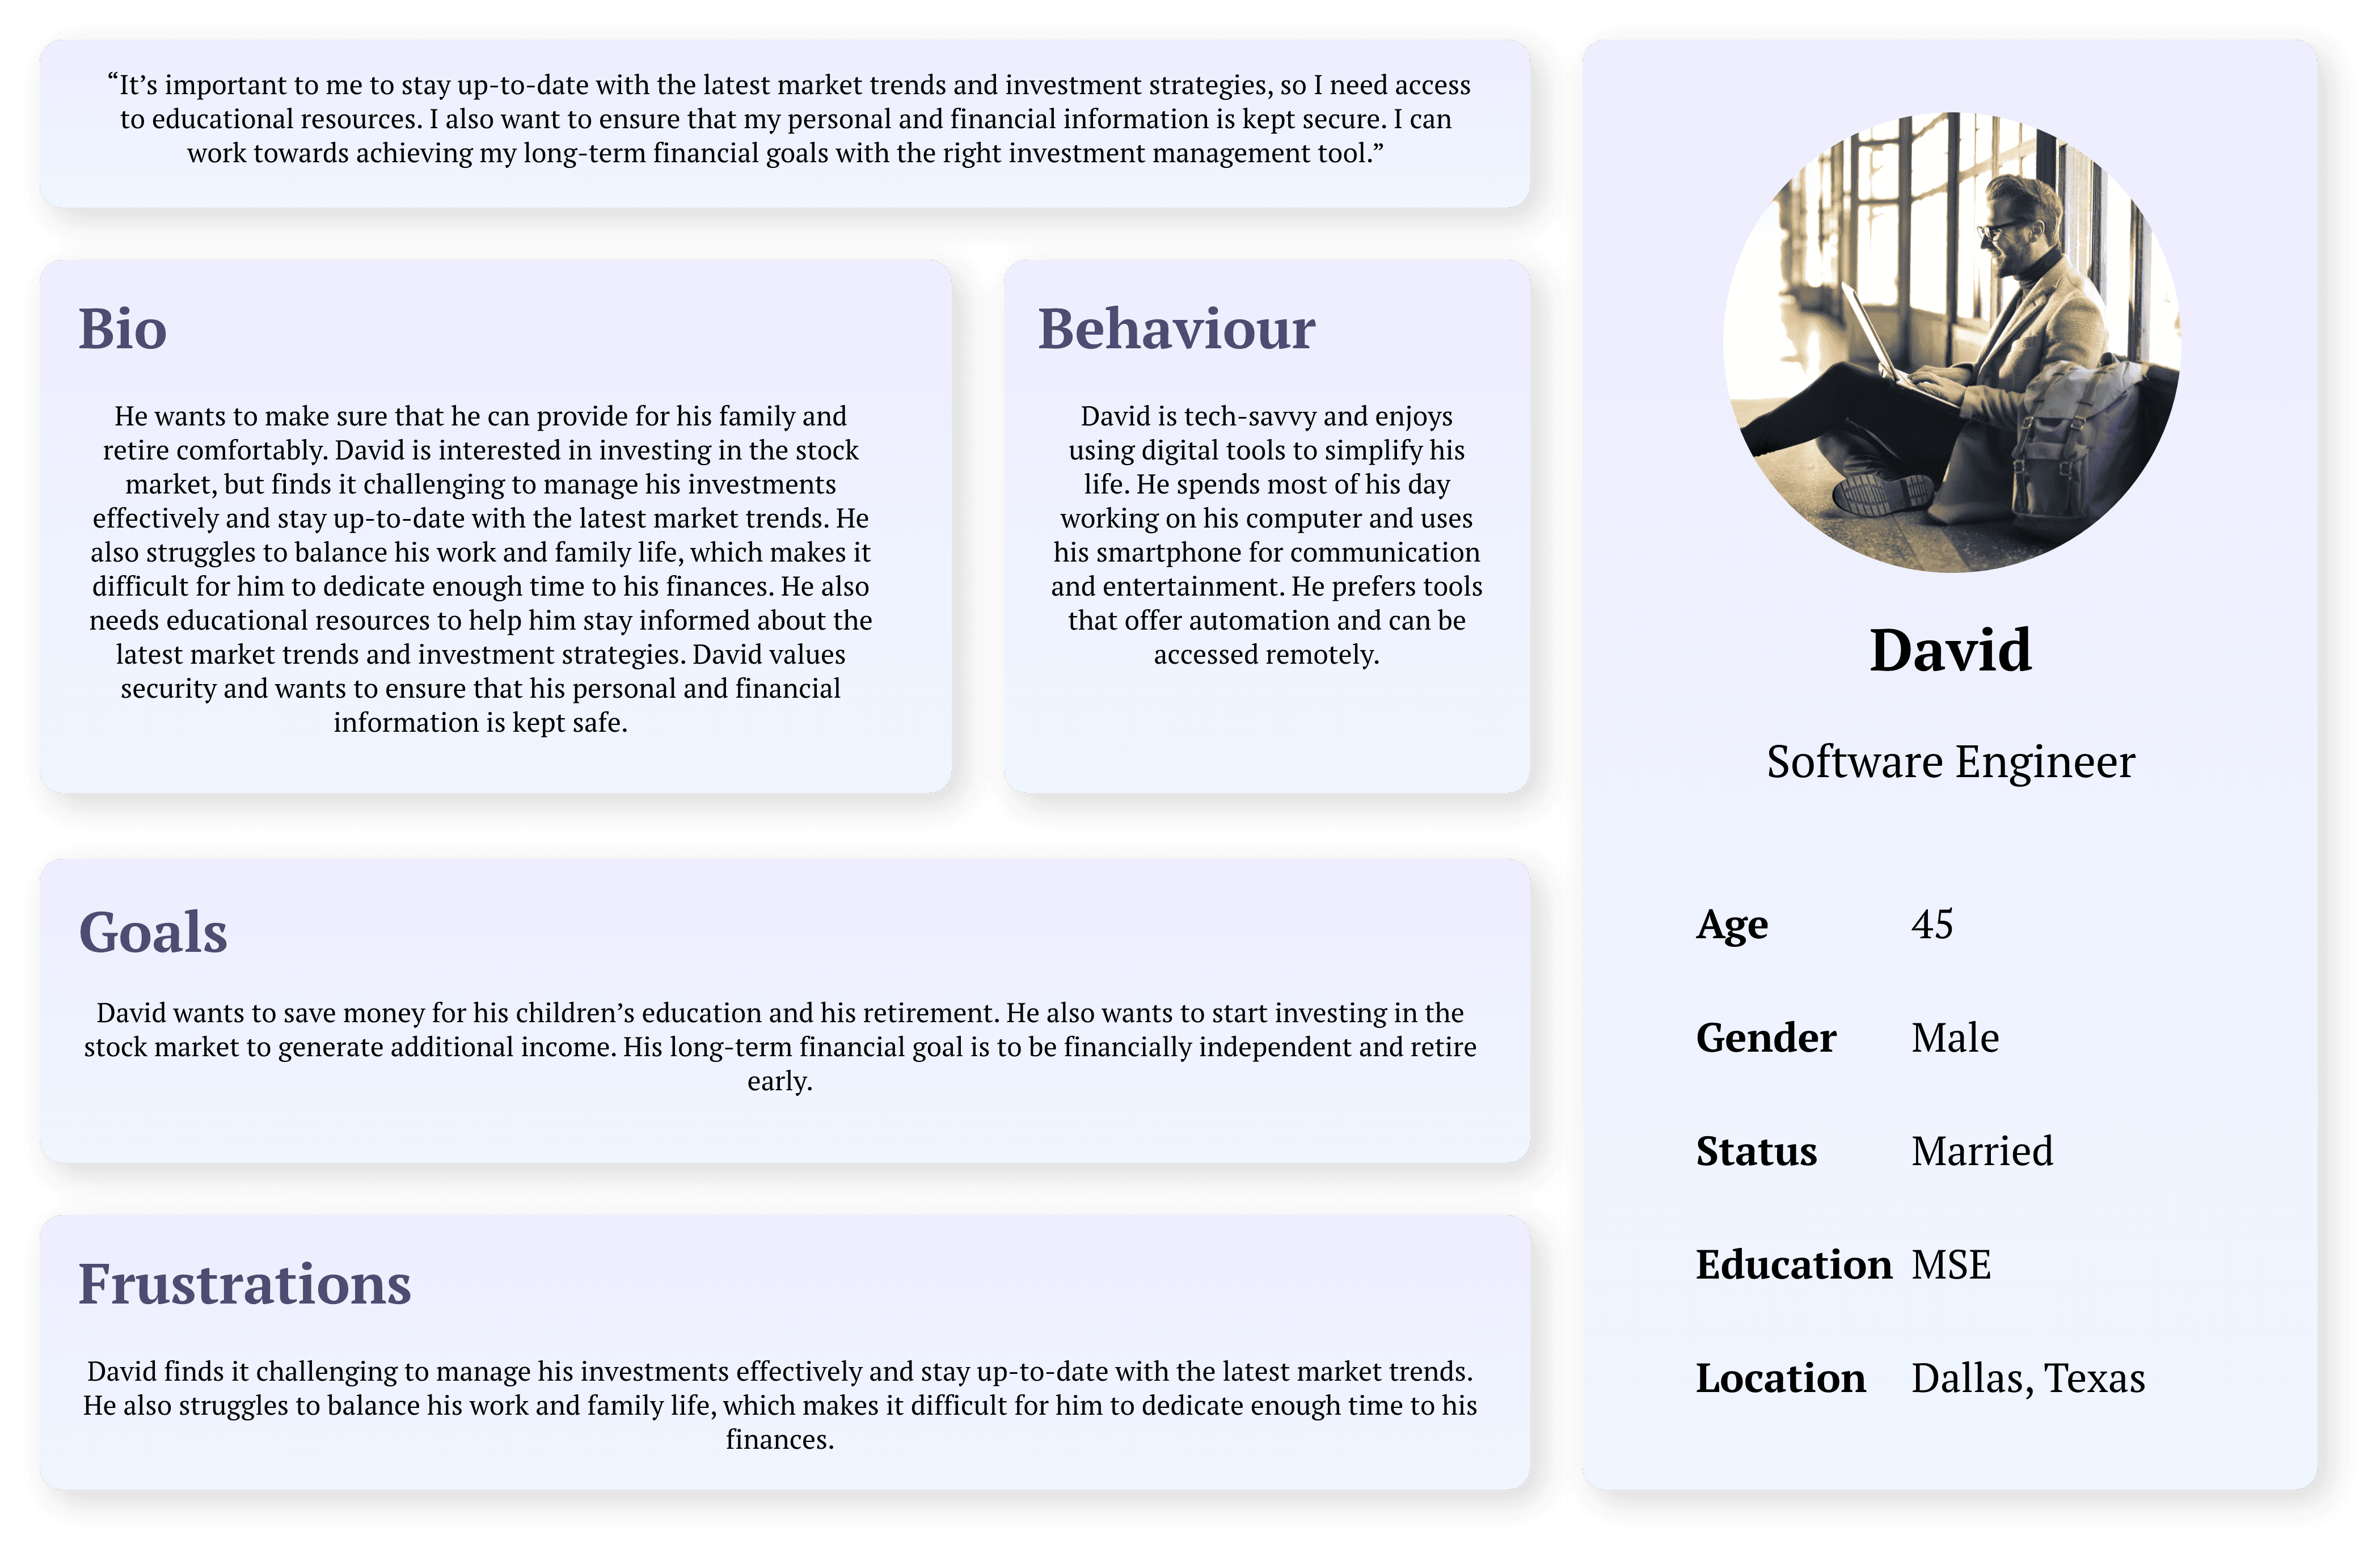
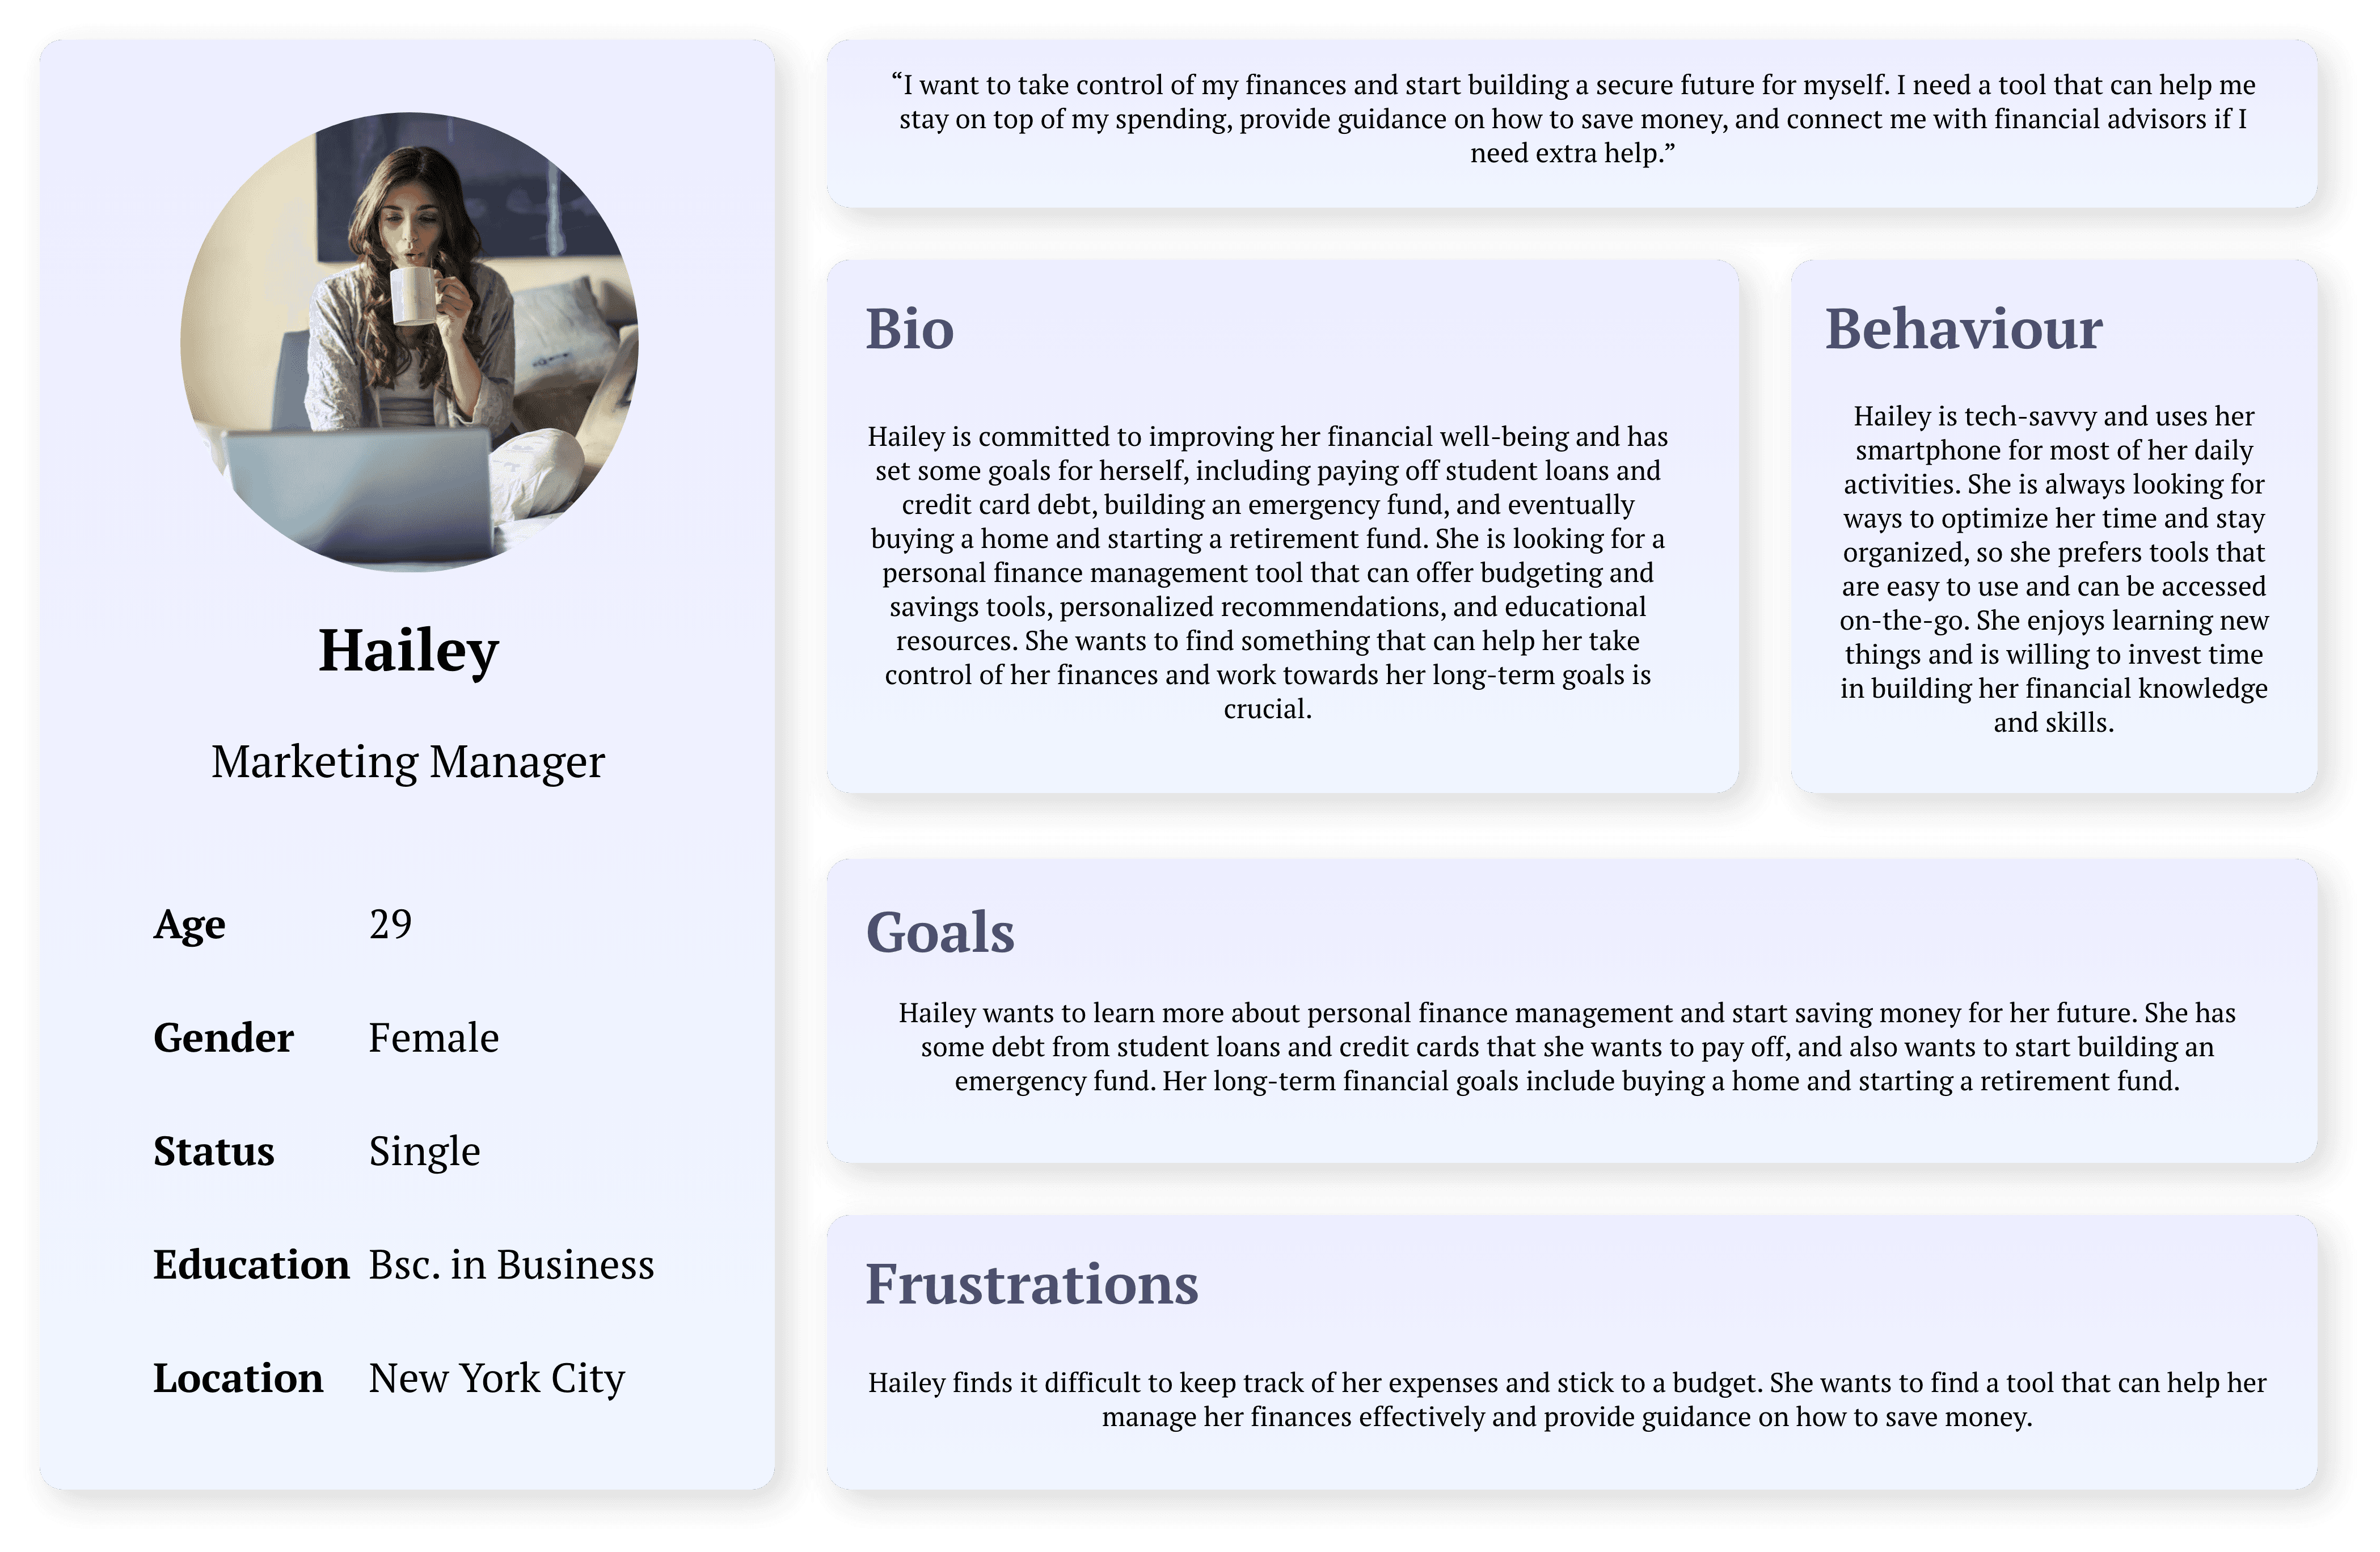
After synthesizing extensive research and insights, two distinct user personas have been crafted. These personas serve as representative archetypes, encapsulating the diverse needs and goals identified through the research, ensuring a user-centred approach in addressing financial well-being and needs.
Affinity Map
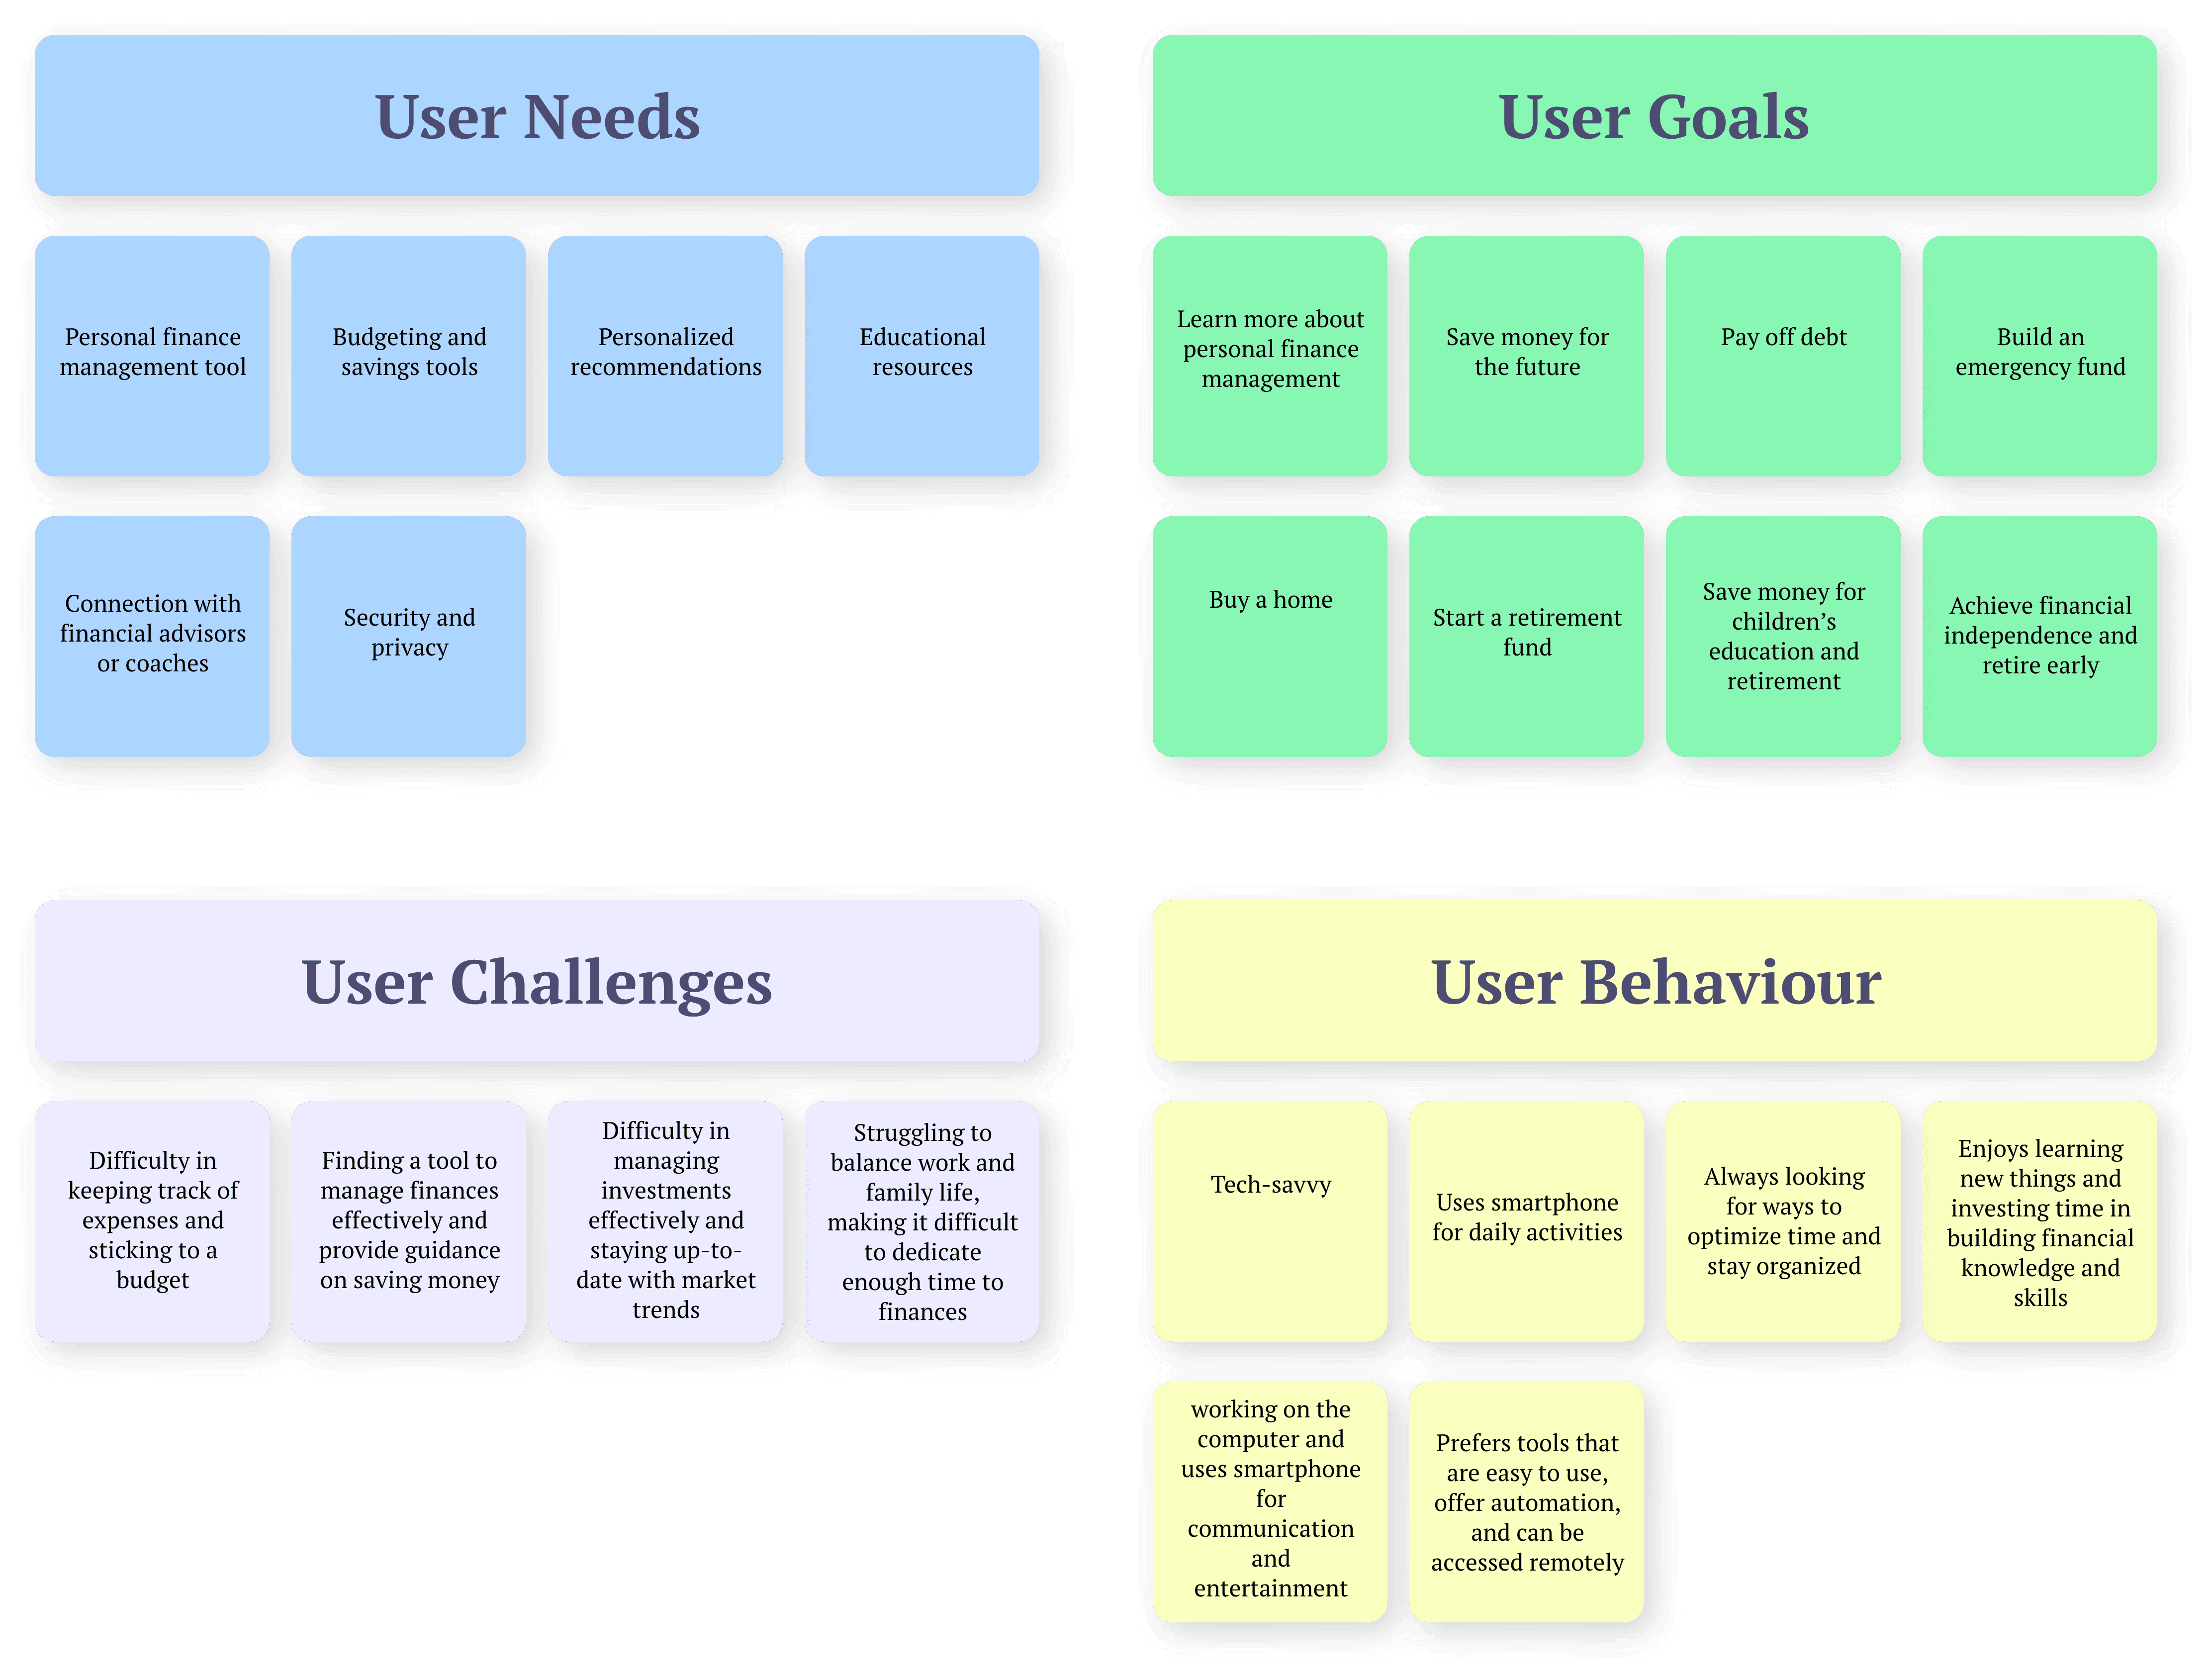
In synthesizing the research findings on financial well-being, an affinity map has been created to visually organize and categorize key insights. The map identifies clusters of related information, helping to reveal patterns, user sentiments, and common themes.
UI Designs
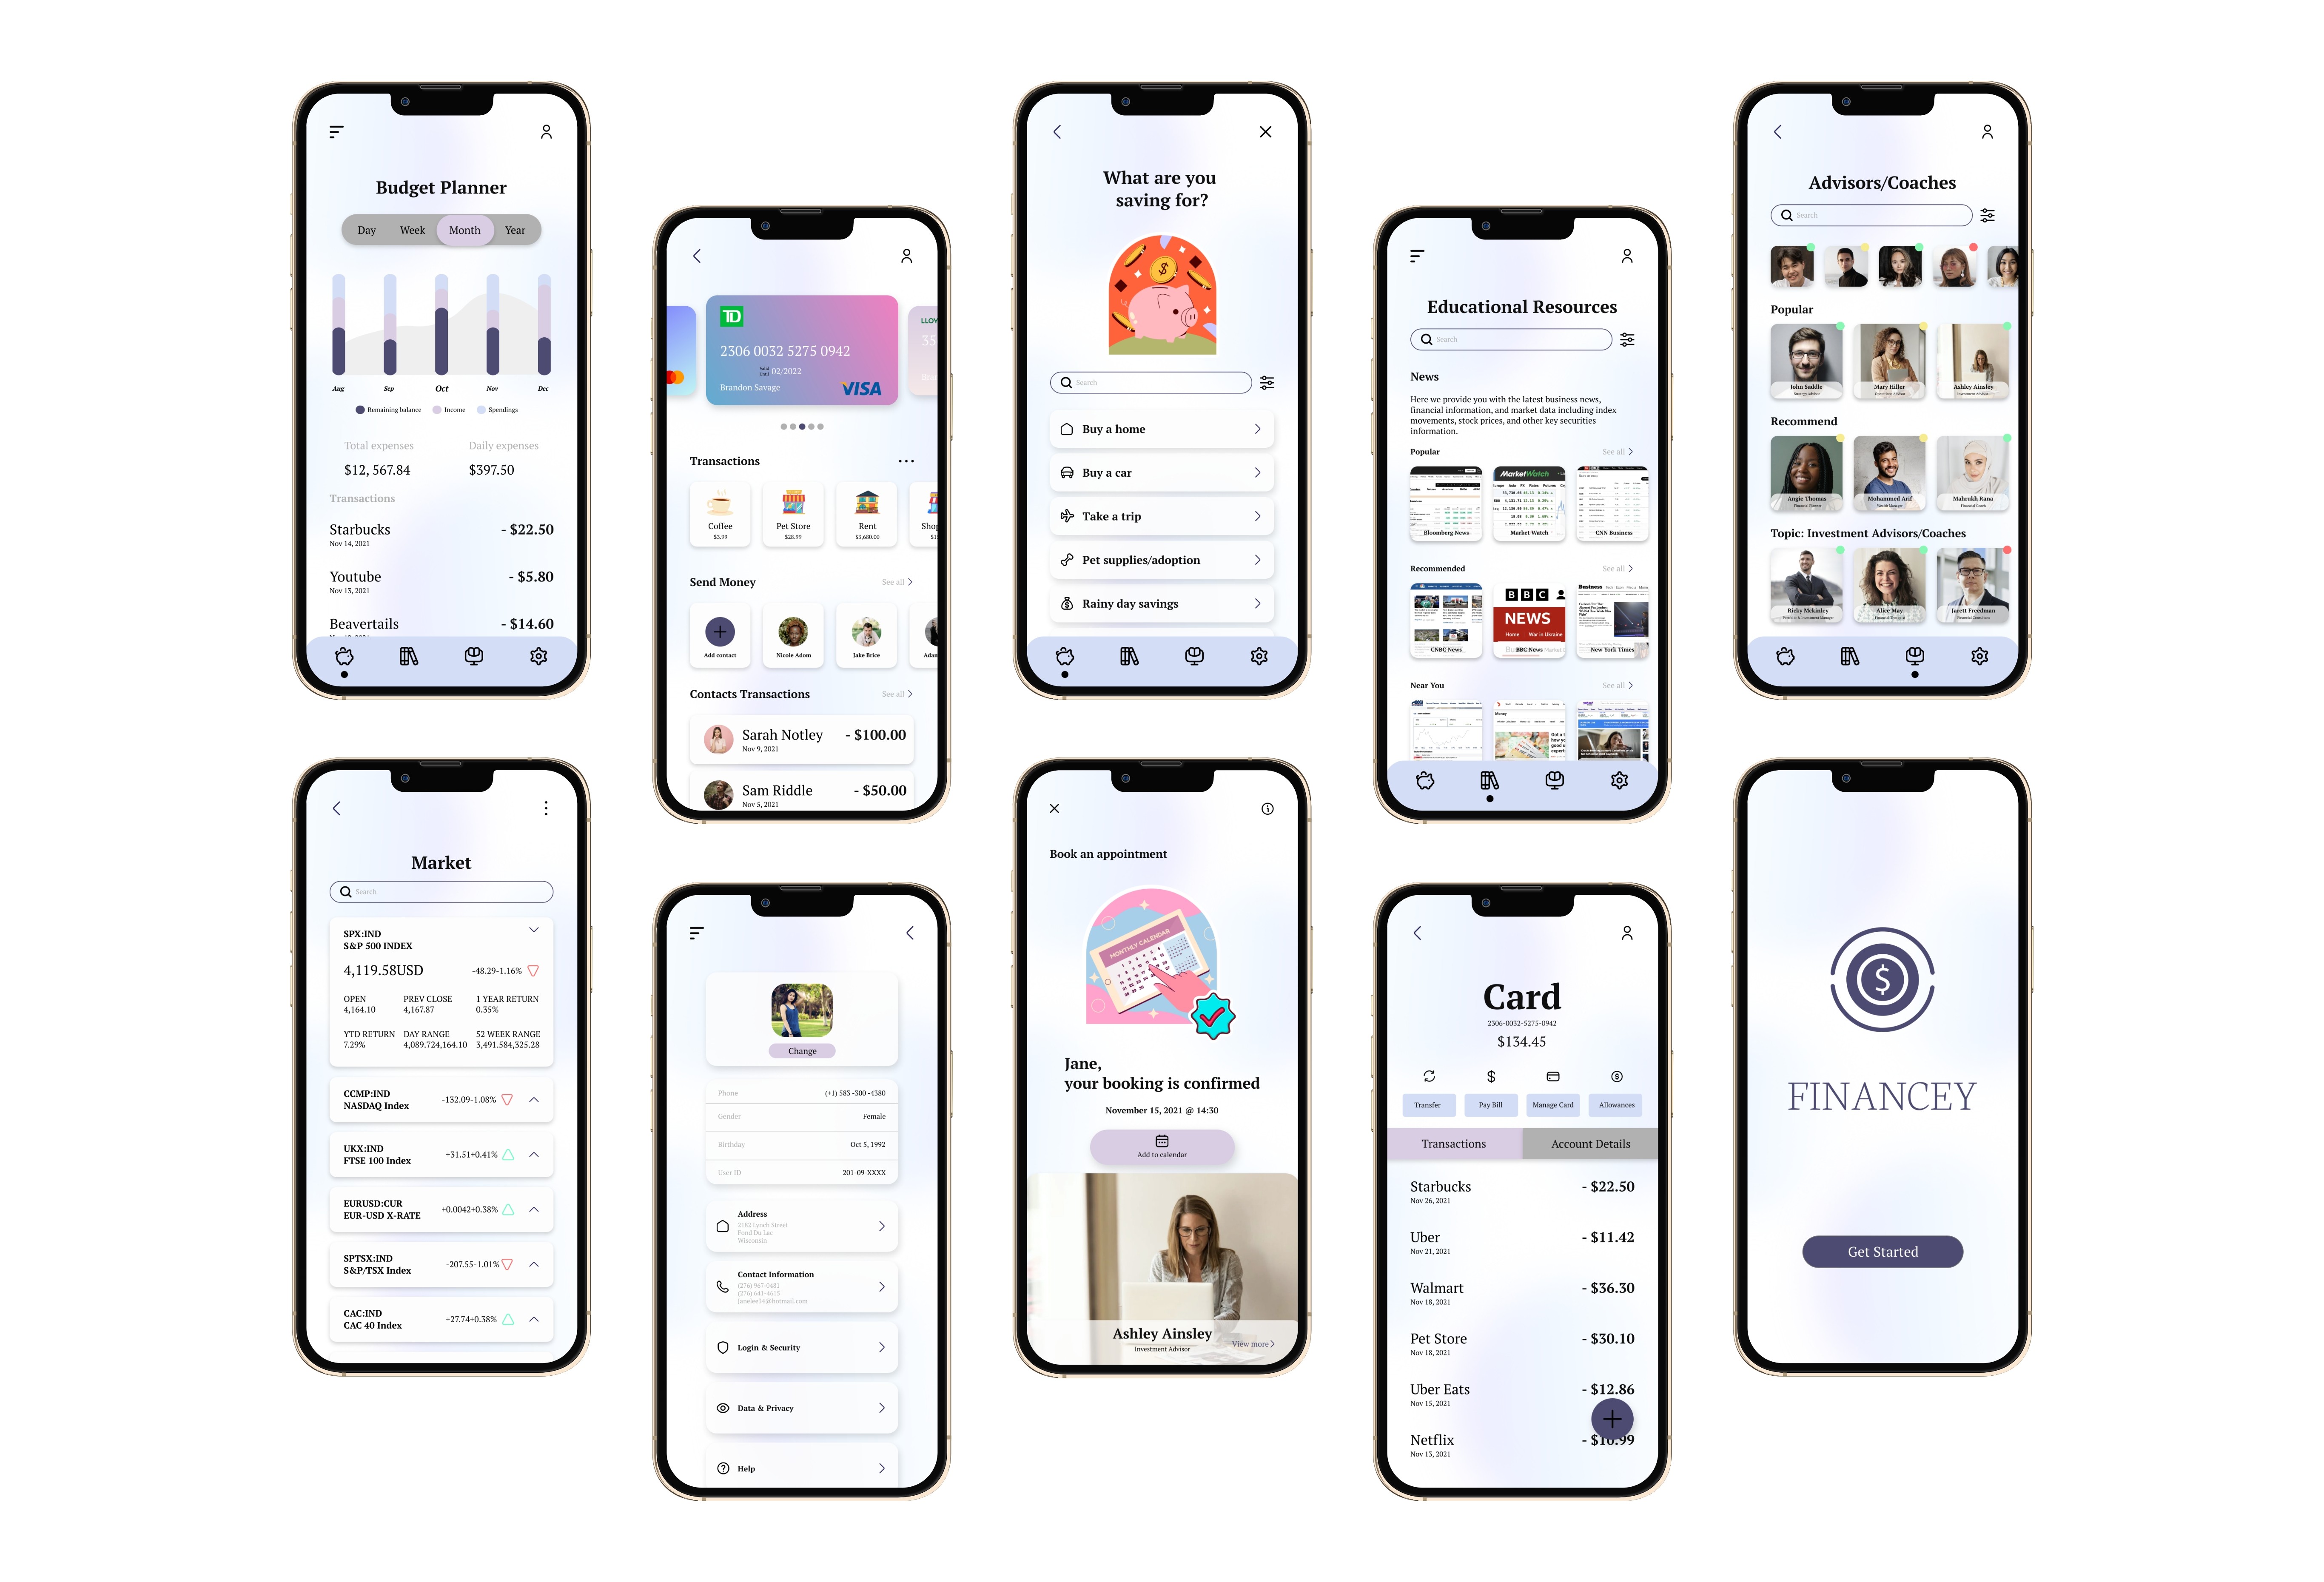
These visuals embody the detailed and polished interface, incorporating color schemes, typography, and precise visual elements. The high-fidelity designs provide a realistic representation of the final product, ensuring a visually engaging and user-friendly experience.
Usability Study
Financey serves as a personalized financial management application designed to assist individuals in understanding and effectively handling their finances. It also presents educational materials and connections to finance advisors or trainers. This UX usability research aims at assessing the user-friendliness of the Financey application and spotting potential enhancements through user responses.
Usability Information
• Study type: Unmoderated
• Location: USA, remote
• Participants: 5 participants
• Length: 20-30 minutes
Findings
User Onboarding: Participants had difficulty setting up their financial profile during the onboarding process. The app could benefit from a more intuitive and streamlined onboarding process.Budgeting and Expense
Tracking: Participants found it challenging to create a monthly budget and track their expenses accurately. The app could benefit from a more user-friendly interface for budgeting and expense tracking.
Educational Resources: Participants found it challenging to find educational resources on investing and retirement planning. The app could benefit from a more comprehensive and easily accessible library of educational resources.
Personalized Recommendations: Participants were looking for more personalized investment recommendations based on their financial goals and risk tolerance. The app could benefit from more advanced algorithms that take into account user preferences and behaviour.Advisor/Coach
Connectivity: Participants found it difficult to connect with a financial advisor or coach for personalized guidance. The app could benefit from a more streamlined process for connecting with financial advisors or coaches.
Takeaways
Financey case study is an enriching and rewarding journey, underscoring the paramount importance of adopting a robust approach in design. The amalgamation of quantitative analysis, leveraging tools like Stata software, and qualitative insights derived from user surveys has bestowed upon me a profound and comprehensive understanding of users' financial habits and challenges.
This holistic experience significantly deepens my appreciation for the iterative design process and user-centric methodologies. The insights gained from this case study are invaluable, influencing not only my current work but also shaping the trajectory of my future projects with an enhanced emphasis on delivering solutions that are not only impactful but also inherently user-friendly.
Financey
UX/UI Research & Design

About
Roles: UX Researcher | UX/UI Designer
Duration: October 2021 - Dec 2021 | Revised May 2022 - August 2022
Tools: Adobe XD, Figma, Adobe Illustrator, Stata
Financey helps users learn about personal finance and manage their money effectively. Financey also provides educational resources and access to financial advisors or coaches. The finance app can help users take control of their finances, improve their financial well-being, and work towards achieving their long-term financial goals.

Project Details
The Problem
The lack of financial education, management skills, and advice can have a significant negative impact on an individual’s financial well-being and quality of life. The absence of financial advice and guidance can also leave people feeling overwhelmed and uncertain about their financial future, leading to anxiety and stress.
The Goal
To empower users to make informed financial decisions, reduce financial stress, and achieve greater financial stability and success over time. It is also to provide users with the tools and resources they need to take control of their finances, improve their financial well-being, and work towards achieving their long-term financial goals.
UX Research
I started with a hybrid research methodology, commencing with the secondary research model in the initial segment of the study and shifting to qualitative research (interrogations and surveys) for the latter part. I performed quantitative analysis using Stata software and the MIDUS questionnaires. I generated syntax, computations, and tabulations on the topic of juvenile finance and comprehensive contentment by utilizing the responses from the mail section of MIDUS.
'MIDUS is a nationwide, long-term data collection in the U.S., placing emphasis on the impacts of psychological, societal, and biological factors in explaining the age-dependent fluctuations in health and happiness amongst two American national samples.'

Picture 1
One of the respondents in the mail portion of the MIDUS was asked “Thinking back to your family’s financial situation when you were growing up, was your family better off or worse off financially than the average family was at that time?” I created a tabulation of the variable “childfin” with and without labels. Based on this tabulation, 2593 people provided valid responses to the question.
Picture 2
The query asked, “Employing a range from 0-10 where 0 symbolizes ‘the least desirable monetary state’ and 10 depicts ‘the most desirable monetary state,’ how would you evaluate your current financial standing?” My analysis focused on U.S residents between the ages of 25-75.
Picture 3
The query posed was, “Using a numerical gauge ranging from 0-10 where zero signifies ‘the worst imaginable financial state’ and ten implies ‘the optimal financial situation,’ how would you assess your current financial picture?” I proceeded with the computation while integrating various parameters. I examined factors such as happiness in life, present employment conditions, financial contentment, health, and lifestyle along with socio-economic standing. These could potentially impact both the extent of financial strain exposure and the state of one's mental health.
Survey
For this investigation, I gathered data from 40 individuals aged between 25 and 75. The participant pool comprises 23 men and 17 women. These people possess diverse income levels, familial structures, earnings, occupations, and educational backgrounds. This is a summary of the observations gathered from the study.
• Research Methodology: Survey
• Participants: 40
• Location: United States of America

User Interviews
In the user interviews, I gained valuable insights into diverse perspectives on financial education, technology's role in personal finance, and motivations for saving money. These interviews illuminate the multifaceted relationship individuals have with financial education, technology, and saving. The findings provide valuable perspectives for informing UX design in the realm of personal finance tools and resources.
Key Insights
• Financial education emerges as a crucial element for overall financial well-being.
• Survey findings indicate diverse strategies employed for financial management, encompassing budgeting, expense tracking, and regular savings.
• Identified areas for improvement include increased knowledge in investing and retirement planning.
• Participants reported facing financial challenges, such as unexpected expenses, job loss, and debt.
• Overcoming challenges involved the formulation of financial plans, seeking advice from professionals, and taking proactive measures to enhance income or reduce expenses.
Personas
After synthesizing extensive research and insights, two distinct user personas have been crafted. These personas serve as representative archetypes, encapsulating the diverse needs and goals identified through the research, ensuring a user-centred approach in addressing financial well-being and needs.


Affinity Map
In synthesizing the research findings on financial well-being, an affinity map has been created to visually organize and categorize key insights. The map identifies clusters of related information, helping to reveal patterns, user sentiments, and common themes.

UI Designs
These visuals embody the detailed and polished interface, incorporating color schemes, typography, and precise visual elements. The high-fidelity designs provide a realistic representation of the final product, ensuring a visually engaging and user-friendly experience.

Usability Study
Financey serves as a personalized financial management application designed to assist individuals in understanding and effectively handling their finances. It also presents educational materials and connections to finance advisors or trainers. This UX usability research aims at assessing the user-friendliness of the Financey application and spotting potential enhancements through user responses.
Usability Information
• Study type: Unmoderated
• Location: USA, remote
• Participants: 5 participants
• Length: 20-30 minutes
Findings
User Onboarding: Participants had difficulty setting up their financial profile during the onboarding process. The app could benefit from a more intuitive and streamlined onboarding process.Budgeting and Expense
Tracking: Participants found it challenging to create a monthly budget and track their expenses accurately. The app could benefit from a more user-friendly interface for budgeting and expense tracking.
Educational Resources: Participants found it challenging to find educational resources on investing and retirement planning. The app could benefit from a more comprehensive and easily accessible library of educational resources.
Personalized Recommendations: Participants were looking for more personalized investment recommendations based on their financial goals and risk tolerance. The app could benefit from more advanced algorithms that take into account user preferences and behaviour.Advisor/Coach
Connectivity: Participants found it difficult to connect with a financial advisor or coach for personalized guidance. The app could benefit from a more streamlined process for connecting with financial advisors or coaches.
Takeaways
Financey case study is an enriching and rewarding journey, underscoring the paramount importance of adopting a robust approach in design. The amalgamation of quantitative analysis, leveraging tools like Stata software, and qualitative insights derived from user surveys has bestowed upon me a profound and comprehensive understanding of users' financial habits and challenges.
This holistic experience significantly deepens my appreciation for the iterative design process and user-centric methodologies. The insights gained from this case study are invaluable, influencing not only my current work but also shaping the trajectory of my future projects with an enhanced emphasis on delivering solutions that are not only impactful but also inherently user-friendly.
Financey
UX/UI Research & Design

About
Roles: UX Researcher | UX/UI Designer
Duration: October 2021 - Dec 2021 | Revised May 2022 - August 2022
Tools: Adobe XD, Figma, Adobe Illustrator, Stata
Financey helps users learn about personal finance and manage their money effectively. Financey also provides educational resources and access to financial advisors or coaches. The finance app can help users take control of their finances, improve their financial well-being, and work towards achieving their long-term financial goals.

Project Details
The Problem
The lack of financial education, management skills, and advice can have a significant negative impact on an individual’s financial well-being and quality of life. The absence of financial advice and guidance can also leave people feeling overwhelmed and uncertain about their financial future, leading to anxiety and stress.
The Goal
To empower users to make informed financial decisions, reduce financial stress, and achieve greater financial stability and success over time. It is also to provide users with the tools and resources they need to take control of their finances, improve their financial well-being, and work towards achieving their long-term financial goals.
UX Research
I started with a hybrid research methodology, commencing with the secondary research model in the initial segment of the study and shifting to qualitative research (interrogations and surveys) for the latter part. I performed quantitative analysis using Stata software and the MIDUS questionnaires. I generated syntax, computations, and tabulations on the topic of juvenile finance and comprehensive contentment by utilizing the responses from the mail section of MIDUS.
'MIDUS is a nationwide, long-term data collection in the U.S., placing emphasis on the impacts of psychological, societal, and biological factors in explaining the age-dependent fluctuations in health and happiness amongst two American national samples.'

Picture 1
One of the respondents in the mail portion of the MIDUS was asked “Thinking back to your family’s financial situation when you were growing up, was your family better off or worse off financially than the average family was at that time?” I created a tabulation of the variable “childfin” with and without labels. Based on this tabulation, 2593 people provided valid responses to the question.
Picture 2
The query asked, “Employing a range from 0-10 where 0 symbolizes ‘the least desirable monetary state’ and 10 depicts ‘the most desirable monetary state,’ how would you evaluate your current financial standing?” My analysis focused on U.S residents between the ages of 25-75.
Picture 3
The query posed was, “Using a numerical gauge ranging from 0-10 where zero signifies ‘the worst imaginable financial state’ and ten implies ‘the optimal financial situation,’ how would you assess your current financial picture?” I proceeded with the computation while integrating various parameters. I examined factors such as happiness in life, present employment conditions, financial contentment, health, and lifestyle along with socio-economic standing. These could potentially impact both the extent of financial strain exposure and the state of one's mental health.
Survey
For this investigation, I gathered data from 40 individuals aged between 25 and 75. The participant pool comprises 23 men and 17 women. These people possess diverse income levels, familial structures, earnings, occupations, and educational backgrounds. This is a summary of the observations gathered from the study.
• Research Methodology: Survey
• Participants: 40
• Location: United States of America

User Interviews
In the user interviews, I gained valuable insights into diverse perspectives on financial education, technology's role in personal finance, and motivations for saving money. These interviews illuminate the multifaceted relationship individuals have with financial education, technology, and saving. The findings provide valuable perspectives for informing UX design in the realm of personal finance tools and resources.
Key Insights
• Financial education emerges as a crucial element for overall financial well-being.
• Survey findings indicate diverse strategies employed for financial management, encompassing budgeting, expense tracking, and regular savings.
• Identified areas for improvement include increased knowledge in investing and retirement planning.
• Participants reported facing financial challenges, such as unexpected expenses, job loss, and debt.
• Overcoming challenges involved the formulation of financial plans, seeking advice from professionals, and taking proactive measures to enhance income or reduce expenses.
Personas
After synthesizing extensive research and insights, two distinct user personas have been crafted. These personas serve as representative archetypes, encapsulating the diverse needs and goals identified through the research, ensuring a user-centred approach in addressing financial well-being and needs.


Affinity Map
In synthesizing the research findings on financial well-being, an affinity map has been created to visually organize and categorize key insights. The map identifies clusters of related information, helping to reveal patterns, user sentiments, and common themes.

UI Designs
These visuals embody the detailed and polished interface, incorporating color schemes, typography, and precise visual elements. The high-fidelity designs provide a realistic representation of the final product, ensuring a visually engaging and user-friendly experience.

Usability Study
Financey serves as a personalized financial management application designed to assist individuals in understanding and effectively handling their finances. It also presents educational materials and connections to finance advisors or trainers. This UX usability research aims at assessing the user-friendliness of the Financey application and spotting potential enhancements through user responses.
Usability Information
• Study type: Unmoderated
• Location: USA, remote
• Participants: 5 participants
• Length: 20-30 minutes
Findings
User Onboarding: Participants had difficulty setting up their financial profile during the onboarding process. The app could benefit from a more intuitive and streamlined onboarding process.Budgeting and Expense
Tracking: Participants found it challenging to create a monthly budget and track their expenses accurately. The app could benefit from a more user-friendly interface for budgeting and expense tracking.
Educational Resources: Participants found it challenging to find educational resources on investing and retirement planning. The app could benefit from a more comprehensive and easily accessible library of educational resources.
Personalized Recommendations: Participants were looking for more personalized investment recommendations based on their financial goals and risk tolerance. The app could benefit from more advanced algorithms that take into account user preferences and behaviour.Advisor/Coach
Connectivity: Participants found it difficult to connect with a financial advisor or coach for personalized guidance. The app could benefit from a more streamlined process for connecting with financial advisors or coaches.
Takeaways
Financey case study is an enriching and rewarding journey, underscoring the paramount importance of adopting a robust approach in design. The amalgamation of quantitative analysis, leveraging tools like Stata software, and qualitative insights derived from user surveys has bestowed upon me a profound and comprehensive understanding of users' financial habits and challenges.
This holistic experience significantly deepens my appreciation for the iterative design process and user-centric methodologies. The insights gained from this case study are invaluable, influencing not only my current work but also shaping the trajectory of my future projects with an enhanced emphasis on delivering solutions that are not only impactful but also inherently user-friendly.
Financey
UX/UI Research & Design

About
Roles: UX Researcher | UX/UI Designer
Duration: October 2021 - Dec 2021 | Revised May 2022 - August 2022
Tools: Adobe XD, Figma, Adobe Illustrator, Stata
Financey helps users learn about personal finance and manage their money effectively. Financey also provides educational resources and access to financial advisors or coaches. The finance app can help users take control of their finances, improve their financial well-being, and work towards achieving their long-term financial goals.

Project Details
The Problem
The lack of financial education, management skills, and advice can have a significant negative impact on an individual’s financial well-being and quality of life. The absence of financial advice and guidance can also leave people feeling overwhelmed and uncertain about their financial future, leading to anxiety and stress.
The Goal
To empower users to make informed financial decisions, reduce financial stress, and achieve greater financial stability and success over time. It is also to provide users with the tools and resources they need to take control of their finances, improve their financial well-being, and work towards achieving their long-term financial goals.
UX Research
I started with a hybrid research methodology, commencing with the secondary research model in the initial segment of the study and shifting to qualitative research (interrogations and surveys) for the latter part. I performed quantitative analysis using Stata software and the MIDUS questionnaires. I generated syntax, computations, and tabulations on the topic of juvenile finance and comprehensive contentment by utilizing the responses from the mail section of MIDUS.
'MIDUS is a nationwide, long-term data collection in the U.S., placing emphasis on the impacts of psychological, societal, and biological factors in explaining the age-dependent fluctuations in health and happiness amongst two American national samples.'

Picture 1
One of the respondents in the mail portion of the MIDUS was asked “Thinking back to your family’s financial situation when you were growing up, was your family better off or worse off financially than the average family was at that time?” I created a tabulation of the variable “childfin” with and without labels. Based on this tabulation, 2593 people provided valid responses to the question.
Picture 2
The query asked, “Employing a range from 0-10 where 0 symbolizes ‘the least desirable monetary state’ and 10 depicts ‘the most desirable monetary state,’ how would you evaluate your current financial standing?” My analysis focused on U.S residents between the ages of 25-75.
Picture 3
The query posed was, “Using a numerical gauge ranging from 0-10 where zero signifies ‘the worst imaginable financial state’ and ten implies ‘the optimal financial situation,’ how would you assess your current financial picture?” I proceeded with the computation while integrating various parameters. I examined factors such as happiness in life, present employment conditions, financial contentment, health, and lifestyle along with socio-economic standing. These could potentially impact both the extent of financial strain exposure and the state of one's mental health.
Survey
For this investigation, I gathered data from 40 individuals aged between 25 and 75. The participant pool comprises 23 men and 17 women. These people possess diverse income levels, familial structures, earnings, occupations, and educational backgrounds. This is a summary of the observations gathered from the study.
• Research Methodology: Survey
• Participants: 40
• Location: United States of America

User Interviews
In the user interviews, I gained valuable insights into diverse perspectives on financial education, technology's role in personal finance, and motivations for saving money. These interviews illuminate the multifaceted relationship individuals have with financial education, technology, and saving. The findings provide valuable perspectives for informing UX design in the realm of personal finance tools and resources.
Key Insights
• Financial education emerges as a crucial element for overall financial well-being.
• Survey findings indicate diverse strategies employed for financial management, encompassing budgeting, expense tracking, and regular savings.
• Identified areas for improvement include increased knowledge in investing and retirement planning.
• Participants reported facing financial challenges, such as unexpected expenses, job loss, and debt.
• Overcoming challenges involved the formulation of financial plans, seeking advice from professionals, and taking proactive measures to enhance income or reduce expenses.
Personas
After synthesizing extensive research and insights, two distinct user personas have been crafted. These personas serve as representative archetypes, encapsulating the diverse needs and goals identified through the research, ensuring a user-centred approach in addressing financial well-being and needs.


Affinity Map
In synthesizing the research findings on financial well-being, an affinity map has been created to visually organize and categorize key insights. The map identifies clusters of related information, helping to reveal patterns, user sentiments, and common themes.

UI Designs
These visuals embody the detailed and polished interface, incorporating color schemes, typography, and precise visual elements. The high-fidelity designs provide a realistic representation of the final product, ensuring a visually engaging and user-friendly experience.

Usability Study
Financey serves as a personalized financial management application designed to assist individuals in understanding and effectively handling their finances. It also presents educational materials and connections to finance advisors or trainers. This UX usability research aims at assessing the user-friendliness of the Financey application and spotting potential enhancements through user responses.
Usability Information
• Study type: Unmoderated
• Location: USA, remote
• Participants: 5 participants
• Length: 20-30 minutes
Findings
User Onboarding: Participants had difficulty setting up their financial profile during the onboarding process. The app could benefit from a more intuitive and streamlined onboarding process.Budgeting and Expense
Tracking: Participants found it challenging to create a monthly budget and track their expenses accurately. The app could benefit from a more user-friendly interface for budgeting and expense tracking.
Educational Resources: Participants found it challenging to find educational resources on investing and retirement planning. The app could benefit from a more comprehensive and easily accessible library of educational resources.
Personalized Recommendations: Participants were looking for more personalized investment recommendations based on their financial goals and risk tolerance. The app could benefit from more advanced algorithms that take into account user preferences and behaviour.Advisor/Coach
Connectivity: Participants found it difficult to connect with a financial advisor or coach for personalized guidance. The app could benefit from a more streamlined process for connecting with financial advisors or coaches.
Takeaways
Financey case study is an enriching and rewarding journey, underscoring the paramount importance of adopting a robust approach in design. The amalgamation of quantitative analysis, leveraging tools like Stata software, and qualitative insights derived from user surveys has bestowed upon me a profound and comprehensive understanding of users' financial habits and challenges.
This holistic experience significantly deepens my appreciation for the iterative design process and user-centric methodologies. The insights gained from this case study are invaluable, influencing not only my current work but also shaping the trajectory of my future projects with an enhanced emphasis on delivering solutions that are not only impactful but also inherently user-friendly.

